By Simon Peterson
Ever wondered how the economy is doing? How do you figure out how healthy the economy is? The answer to these questions: one key piece of economic prediction is the Dow Theory. The Dow Theory is especially applicable right now, since it conveyed one of its common “signs” early in October. This means an uncommon difference between two sectors of the economy or averages. The general or “macro” view of our current economy is shown most accurately through the Dow Theory. The Dow Theory leads us through economic uncertainty and guides us to what the markets are really telling us.
The Dow Theory came out of the late nineteenth century compositions of Charles Dow (1851-1902), the originator of The Wall Street Journal. Mr. Dow made a portion of the principal securities exchange records, including the Dow Jones Industrial Average and the Dow Jones Transportation Average. One of his most essential theories was that securities exchange inclines often show a pattern that lasts for years. The way investors bought and shorted the market was heavily affected by Charles Dow.
One sign to telling a principle change in the market from shorter-term change is that the Dow Industrial and Transport averages are moving in a similar way. Dow constructed his financial products with respect to industrial stocks. He concentrated on producers of products in the economy. He also put shed light on the industry’s transports and movers of merchandise.
At the point when the two averages go in particular directions, it’s an indication that the primary change might be going to switch. How they get back in a state of harmony reveals the market viewpoint.
Both averages were in a sideways/descending stage in late 2014 through mid-2016. During mid to late 2016, they started rising. The two achieved a pinnacle of sorts in March 2017. The Industrials were around 21,125 and the Transports around 9,600. At that point, both moved downwards. This joint descending pattern drove Dow Theory believers to think about whether the market had entered another descending pattern, one that could go for a month or even years.
Industrial
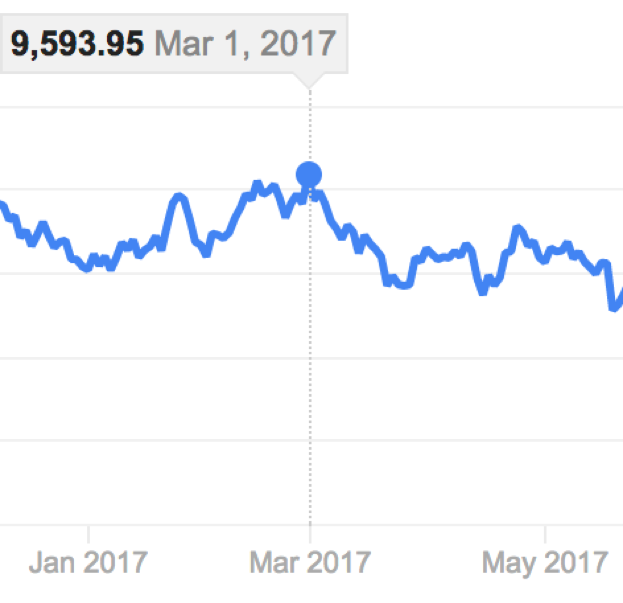
Transportation
![]()
The Transports dropped more than the Industrials. However, this is unessential in Dow Theory. What makes a difference is that the Industrials surpassed their March top toward the beginning of June; however, the Transports didn’t. This new high by the Industrials was powerful, but not indisputable in Dow Theory terms. Despite the fact that the Dow Transports had gone upwards, the Industrials stayed beneath its March top.
By then, the Dow Industrials started falling once again. This fall wasn’t as severe for Transports, however. Dow Theory may recommend that the pattern had to be going downwards, and it did not.
To generalize about the economy using the Dow Theory and the Dow averages, I have to look at things from a macro or bird’s eye view. I am looking at general monthly numbers and yearly trends to get a general view of how the economy is doing and not a specific one from any part of the economy. This is what the Dow Theory and averages are used for.
Both lists continued rising. The Transports surpassed its March top on July 3. This was not abnormal, as it surpassed a monthly top before.
In Dow Theory terms, this proved the rising pattern that started right on time in 2016. Our understanding has changed however the principle Dow Theory is that the rising pattern should proceed for some time.
There is no question that the Dow Theory is relevant to our current economy, but who uses it? What role does it play in my life? For example, high-level quantitative analysts at insurance companies will use Dow Theory to decide how the economy is doing thus using it to price the monthly premiums for your house or even your car. The Dow Theory also lets them decide which people to offer insurance to. If the economy is unhealthy, the company will not take high-risk customers. The widely applicable Dow Theory measures how well we are doing now and how we will do taking into account all economic sectors.
